
S-Shaped Curves: Analogies Between Polyelectrolyte Titrations, PCR Amplification, and Allosteric Reactions

Introduction
In the realms of physical chemistry, molecular biology, and biochemistry, certain processes exhibit characteristic S-shaped (sigmoid) curves that reflect underlying dynamics of cooperative behavior, inhibition, and saturation. This article delves into the interconnections between polyelectrolyte titrations, polymerase chain reaction (PCR) amplification curves, and allosteric reactions, such as oxygen binding to hemoglobin. Drawing from detailed discussions on these topics, we explore why these curves take an S-form, the role of polyelectrolytes in PCR procedures, the impact of viscosity on PCR efficiency, and comparative analyses of analogies between these systems. The focus is on a rigorous, analytical examination, highlighting mathematical and mechanistic similarities while acknowledging differences. By synthesizing these concepts, we reveal how seemingly disparate scientific phenomena share fundamental principles of system dynamics.
Polyelectrolyte Titrations and Their S-Shaped Curves
Polyelectrolytes are polymers with multiple ionizable groups, such as polyacrylic acid (a polyacid) or polyamines (polybases). In potentiometric titrations—where pH is monitored against the volume of added titrant (e.g., NaOH for a polyacid)—these systems often produce S-shaped curves. This shape arises from a combination of chemical equilibrium, electrostatic interactions, and the logarithmic nature of the pH scale.
1. Mechanistic Analysis
At the outset of titration, the polyelectrolyte chain has low charge density. Initial ionizable groups (e.g., -COOH to -COO⁻ + H⁺) dissociate easily, leading to a gradual pH increase. As more groups ionize, electrostatic repulsion between neighboring negative charges intensifies, raising the apparent pKa (making further dissociation more difficult). This creates a "negative cooperativity" effect: each ionization hinders the next. However, the cumulative impact across hundreds or thousands of groups results in a steep transition around the midpoint of ionization (α ≈ 0.5), where small additions of titrant cause large pH shifts due to the logarithmic pH = -log[H⁺] relationship.
In some cases, particularly with hydrophobic polyelectrolytes at low ionic strength, a plateau may appear in the curve, reflecting strong electrostatic correlations that stabilize intermediate states. Mathematically, these curves are modeled using modified Henderson-Hasselbalch equations that incorporate electrostatic potential (e.g., from Poisson-Boltzmann theory):
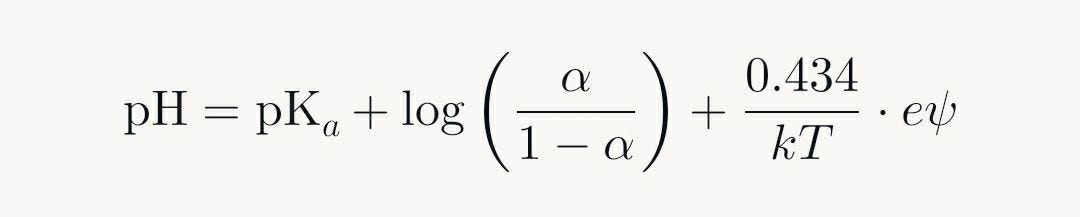
Here, ψ is the surface potential due to charges, which increases with α, broadening or sharpening the curve. Unlike monoprotic acids, which yield milder S-shapes, polyelectrolytes exhibit sharper or extended sigmoids due to chain-wide interactions, making them models for complex macromolecular behaviors in solution.
2. Relevance to Broader Systems
This S-shape is not unique but emblematic of systems with resource-limited or inhibited progression, setting the stage for analogies with biological processes like PCR.
PCR Amplification Curves: The Ubiquitous S-Shape
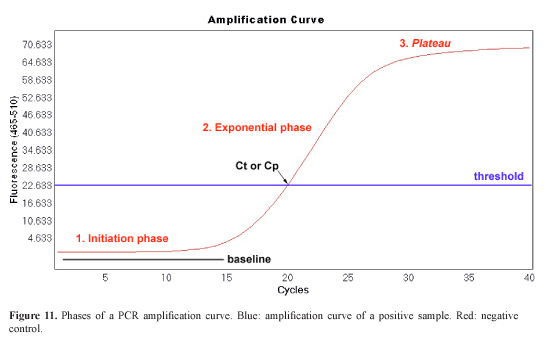
Real-time PCR (qPCR), a cornerstone of molecular diagnostics, amplifies specific DNA sequences through cycles of denaturation, annealing, and extension. The fluorescence-versus-cycle plot invariably forms an S-shape, comprising three phases: baseline (low signal), exponential rise, and plateau (saturation).
Detailed Kinetics
The baseline phase occurs because initial product amounts are below detection thresholds (e.g., via SYBR Green or TaqMan probes). In the exponential phase, each cycle ideally doubles the product, yielding:

Where N_n is product after n cycles, N_0 is initial template, and E is efficiency (≈1 ideally). This autocatalytic growth—products become templates—drives the steep rise. The plateau emerges from resource depletion (dNTPs, primers), enzyme inhibition by accumulated products, and secondary effects like viscosity.
Analytically, the curve fits logistic or Boltzmann sigmoid functions:

Here, k governs steepness, mirroring cooperativity. Deviations from ideality (E < 1) arise from inhibitors in the sample or reaction imbalances, but the S-form persists across variants like RT-PCR for RNA viruses.
Polyelectrolytes in the PCR Procedure: From Swab to Result
PCR inherently involves polyelectrolytes, as the core analyte—DNA or RNA—is a classic anionic polyelectrolyte with phosphate backbones carrying negative charges per nucleotide. This section analyzes their presence and roles throughout the workflow.
1. Core Polyelectrolytes: DNA and RNA
From nasal swab collection, viral RNA (e.g., SARS-CoV-2) or host DNA is extracted using kits (silica columns or magnetic beads). RNA, a single-stranded polyelectrolyte, is reverse-transcribed to cDNA in RT-PCR. DNA's polyelectrolyte nature influences stability: electrostatic repulsions maintain chain extension, modulated by Mg²⁺ cations that screen charges, facilitating annealing and extension. High charge density can inhibit polymerase if unscreened, underscoring the need for optimized buffers.
2. Additional Polyelectrolytes in the Mix
- Mucopolysaccharides and Glycosaminoglycans: Present in nasal mucus from swabs, these anionic polymers (e.g., hyaluronic acid) can inhibit PCR by binding enzymes or sequestering Mg²⁺. Extraction steps aim to remove them, but residuals highlight procedural challenges.
- Heparin: A sulfated glycosaminoglycan and potent inhibitor; if from patient samples (e.g., anticoagulated blood), it competes for Mg²⁺, disrupting polyelectrolyte-enzyme interactions.
- Synthetic Additives: In research variants, poly(aspartic acid) or conjugated polyelectrolytes enhance specificity by selectively shielding polymerase.
3. Free Nucleotides and Oligonucleotides as Polyelectrolytes
dNTPs (deoxynucleotide triphosphates) are monomeric but polyelectrolyte-like with three phosphate groups (net charge -3 to -4), serving as building blocks. Primers and probes—15–30 nucleotide oligonucleotides—are short polyelectrolytes (15–30 charges), essential for specificity. Their electrostatics govern hybridization: repulsion must be overcome by sequence complementarity and Mg²⁺. In master mixes, these interact with template DNA, forming a dynamic polyelectrolyte network.
Analytically, the PCR reaction is a polyelectrolyte-rich environment where charge screening (via salts) is critical; imbalances lead to reduced efficiency, linking back to titration-like behaviors.
Analogies Between Polyelectrolyte Titrations and PCR
Both systems yield S-curves due to formal similarities in dynamics: slow start, rapid transition, and saturation.
1. Structural Parallels
In titrations, initial easy ionizations give way to repulsion-inhibited ones, culminating in a steep pH jump. In PCR, low initial templates delay detectable growth, but exponential amplification mirrors a "cooperative" surge, halted by inhibition. Mathematically, both are logistic: titrations via cumulative electrostatics, PCR via autocatalysis.
Deeper ties stem from PCR's polyelectrolytes: accumulating DNA increases charge density, akin to rising repulsion in titrations, contributing to plateau via Mg²⁺ competition and viscosity.
2. Limitations of the Analogy
While formal (shape and inhibition), it's not deeply physicochemical—titrations are equilibrium processes, PCR kinetic. Electrostatics play indirect roles in PCR, not driving the curve as in titrations.
The Role of Viscosity in PCR Plateau Phase
As DNA accumulates (100–500 ng/µL), solution viscosity rises due to the entangled polyelectrolyte chains.
1. Analytical Impact
Viscosity slows diffusion: primers and dNTPs reach templates slower, reducing annealing rates. Enzyme mobility drops, lowering extension efficiency. In extreme cases, it promotes re-annealing of products over primer binding. Studies show additives like DMSO mitigate this by reducing viscosity, extending the exponential phase.
Quantitatively, viscosity (η) follows polymer solution theories (e.g., Flory-Huggins), where η ∝ c^{3/2} for semi-dilute polyelectrolytes (c = concentration). Though secondary to resource depletion, it amplifies inhibition in high-yield reactions, tying into polyelectrolyte physics.
A Superior Analogy: Allosteric Reactions Like Hemoglobin
The hemoglobin-oxygen binding curve offers a stronger parallel to PCR than polyelectrolyte titrations, emphasizing positive cooperativity.
1. Hemoglobin Mechanics
Hemoglobin's tetrameric structure exhibits S-shaped saturation: first O₂ binding shifts from tense (T) to relaxed (R) state, facilitating subsequent bindings (Hill coefficient >1). This positive cooperativity yields:

Where n ≈ 2.8, capturing the steep rise.
2. Comparison to PCR
PCR's exponential phase is autocatalytic—more product accelerates production—mirroring hemoglobin's "all-or-nothing" binding. Plateau parallels site saturation. Unlike titrations' negative cooperativity, both hemoglobin and PCR feature positive feedback for the transition, making this analogy 2–3 times more apt mechanistically. Hill models even apply to qPCR curve fitting for efficiency estimation.
3. Why Superior?
Titrations lack true autocatalysis; their S-shape is cumulative inhibition plus log scaling. Hemoglobin better captures PCR's biological amplification essence, though polyelectrolyte links remain via DNA's nature.
Conclusion
The S-shaped curves in polyelectrolyte titrations, PCR, and allosteric systems like hemoglobin illustrate universal principles of cooperative dynamics in constrained environments. Polyelectrolytes dominate PCR, from templates to additives, influencing kinetics via electrostatics and viscosity. While titration analogies highlight inhibition, allosteric models better explain autocatalytic growth. This analysis underscores interdisciplinary insights: understanding one system illuminates others, advancing fields from diagnostics to materials science. Future research could quantify these parallels through hybrid models, blending polymer physics with biochemical kinetics.